Table of Contents
SaaS funnel template
I’m currently a fractional CMO for 3 different B2B SaaS. As I have limited time for each SaaS I need to focus on what has the greatest impact.
Identifying what will have the biggest impact is not straightforward. In this article, I will share the template I’m using to prioritize marketing activities.
With SaaS marketing, the marketing job doesn’t finish with user acquisition. The SaaS business model relies on creating recurring revenues. This can be a challenge to prioritize marketing activities as a SaaS marketer, you can work on any stage of the funnel to boost revenues:
- bring more top-of-the-funnel (aka more web traffic)
- improve the signup rate with better website copy
- improve activation rate with a better email onboarding sequence
- boost upsell with trigger-based behavioral email
- lower churn & boost retention
All those activities will help improve the Monthly Recurrent Revenue (MRR) which is usually the main KPI for SaaS businesses.
Your current funnel is the main variable for prioritizing marketing activities. That is why I created a template modeling MRR based on the funnel. In this article, I will detail how to :
- Fill in the template with your current funnel metrics
- Use what-if scenarios to see which funnel stage can have the biggest impact on MRR
- Choose which stage to focus on
- Use the template to compare different growth experiment
Step 1: fill in the template with your funnel metrics
The template is quite forward to use :
First, access my SaaS funnel template and make a copy of the template for yourself (under the file menu click Create a copy).
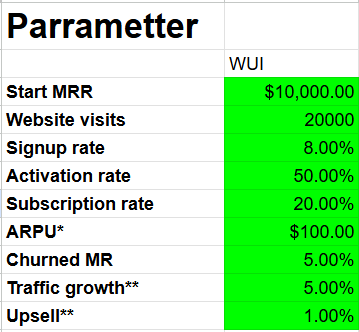
Then you need to fill in the parameters (highlighted in green) on the “Overview” sheet :
Once filled in the template is ready to use.
Step 2: Use what-if scenarios to see which funnel stage can have the biggest impact on MRR
Now that you have all the data filled in, you can start using the template.
The “Baseline” sheets will give you some MRR protection based on your current funnel. Note that the SaaS funnel rarely stays the same and therefore those predictions aren’t reliable in the long run.
In my experience, this revenue model is ok for 1 one-year time horizon if your saas is post-market/fit. If your saas is pre-market/fit, I don’t recommend trusting the model above 1 quarter.
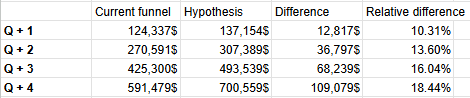
The main value of the template is in the “Overview” sheet. You will see the projected scenario for what-if scenario where each funnel stage was improved by 1 % point :
parameters.png
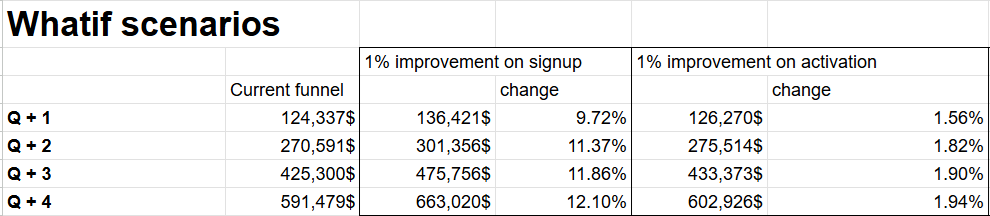
For example in the demo stat currently in the template, if you increase the activation rate from the current 50 % to 51 % you will generate 126270$ extra revenue by the end of the quarter. This is a 1.56% increase in MRR compared to the baseline.
On the other hand, if you increase the signup rate from 8% to 9%, you will generate 126421$ extra revenue. This is a 9.72% increase in MRR compared to the baseline scenario.
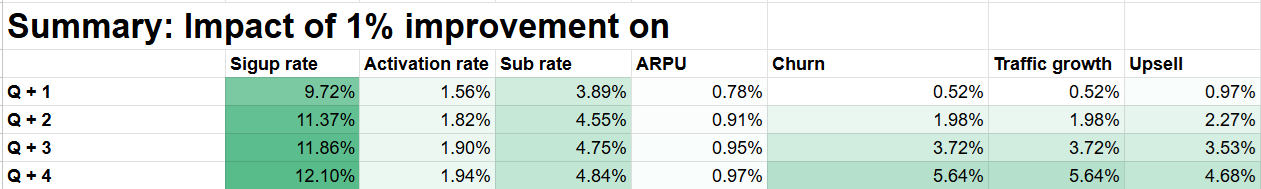
Those what-if scenarios can give you a good idea about which stage of the funnel has the biggest impact on revenue. You will even have a summary view showing the impact of a 1% improvement on each stage:
 However, you shouldn’t blindly choose to focus on the stage with the best what-if scenario there are more variables to take into consideration.
Step 3 Choose which stage to focus on
Now that you know what will have the biggest impact on revenue you should put in perspective the effort required to get a 1 % point improvement.
Check the benchmark
A great way to estimate the effort is to use benchmarks. For example, google “SaaS activation rate benchmark” to get the latest data on the current activation rate.
At the time of writing, the activation rate benchmark according to userpilot is 37%.
In the demo scenario that I showcased before the activation rate is at 50 % far above the current benchmark. It will therefore be quite challenging to increase the conversion rate by 1 % extra point.
Check your experiment backlog
When estimating the effort I also like to review the current backlog of growth experiments. I always tag my growth experiments based on the funnel stage they should impact. That allows me to quickly check if I have any quick wins in the backlog.
Check interdependency and synergies
The last thing to consider is the interdependency between each step. Your funnel is a complex system where all steps are interconnected.
For example, if you want to increase your top funnel by testing a new ad channel, your signup rate might go down. There is always a risk of bringing irrelevant traffic when you are experimenting with a new channel.
Another thing to consider is potential synergies from working on different steps of the funnel at the same time. Yes, sometimes you don’t want to focus on only one step.
If you are working on a small scale with less than 500 website visits per month, you should always dedicate part of your time to the top of the funnel, even if other parts of the funnel would have a bigger impact.
Getting more top of funnel means more people will cycle through your funnel. That means more people to A/B test with your onboarding sequence to boost the activation (our other A/B test later in the funnel.
By bringing more top of the funnel you will be able to iterate faster on downstream stages of the funnel.
Bonus: Use the template to prioritize growth experiments
By now you should know how to select the best funnel stage to focus on.
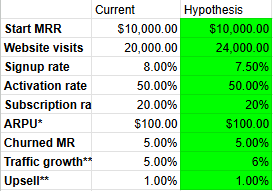
My template has a bonus functionality: the sheet « QuickTest » can help you scope a Growth experiment.
Let’s take an example «You want to test a new advertising channel ».
This should have 2 impacts on your funnel :
- More website trafic
- Potentially a drop in signup rate as you are bringing less relevant traffic
Fill in the information in the template :
The template will compute the impact of your experiment on revenue for the next quarter :
That is a handling tool to compare different growth experiments. The revenue model is far from perfect. However, using the same model to scope every experiment is a good prioritizing tool.